Hello, and happy Wednesday! I hope you’re enjoying an amazing week and that the weather outside your window is prettier than the dreary, rainy scene I’m experiencing today. It’s at this point in the year that I begin to think on rainy days … “what if it were about 30 degrees cooler … I wonder how much snow this would amount to …” #teacherlife 🙂 I took a rare mid-week personal day today to attend the weekly chapel service with my daughters at their school, catch up on grading for all of my classes, ponder the possibility of (and most likely apply for) a specialist degree program in administration, wear sweatpants, drink coffee, watch Harry Potter, blog, and drink (as usual) TONS of coffee. Today, I’m excited to share how my students are using Google Forms, Google Sheets, and Classroom to assess their learning and chart their learning goals, providing them with a clear idea of where they are, where they’re going, and how they’ll get there … visible learning.
One of my teacher goals for the school year is to use pre and post-assessments for every unit so my students can actually visualize “where they are” in their learning of content. In our earlier units, I used Google Classroom to assign a Google Form that served as both a pre and post-assessment of learning. Students completed the form and viewed their score. After we completed our unit, the students took the post-assessment, viewed their score, and I walked around to them and individually reminded of their pre-assessment score. The looks on their faces were WONDERFUL! All students made great improvement over the course of the unit. Some went from 0/8 to 8/8, others went from a 6/8 to 8/8, while some went from a 0/8 to a 5/8. I was proud of all of my students and their expressions showed they were proud of themselves as well.
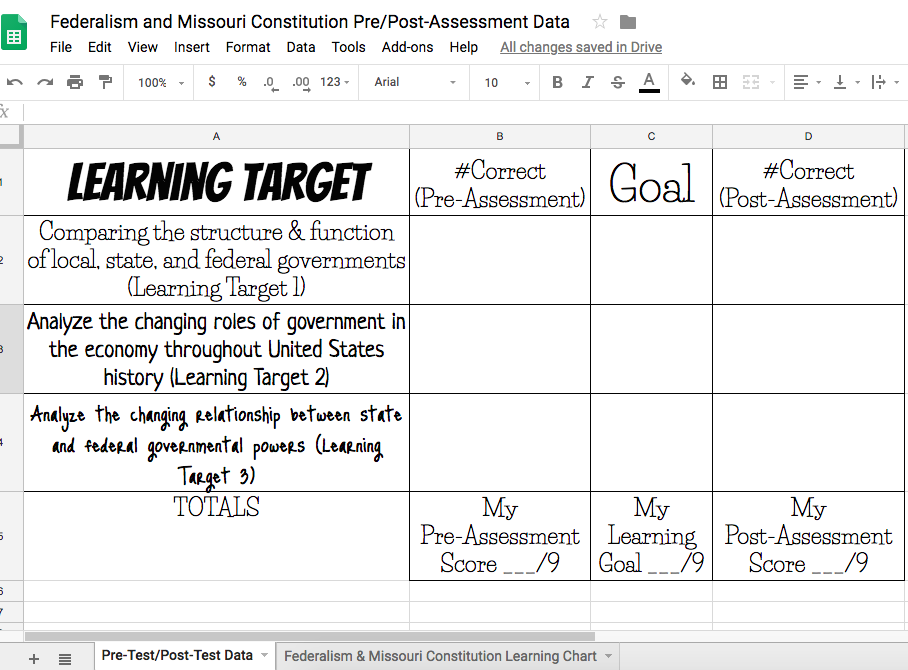
While this pre/post-assessment routine provided both me and my students with great data (and a boost of self-esteem) I wanted to provide them with a more concrete visible learning strategy. I also wanted them to actually see “where they are” when it comes to meeting our learning standards. SO … I created a Google Sheet where students can collect data from their pre-assessment, set their goal for each specific learning target, and view their data in the form of a chart. My reasoning behind this activity was not only to provide students with a visible representation of what they’re learning but also to give them an opportunity to practice using a spreadsheet to collect and view data <– one of those “real-world skills” that will help them outside of my classroom as well. They enter the data on the “Pre-Test/Post-Test Data” sheet and then can view a learning chart on the “Federalism & Missouri Constitution Learning Chart” sheet! If you’d like to use this activity with your students please click here to make a copy of the Google Sheet. Then, edit your standards and assign the spreadsheet to your students via Google Classroom. Done! 
How do you encourage your students to visualize what they’re learning?


[…] the beginning of this school year, I decided to commit myself to using pre and post-assessments for every unit, and right after Christmas my students charted their pre and post-assessment data, […]